GOODYEAR REPORTS ALL-TIME RECORD SEGMENT OPERATING INCOME
30 Oct 15
AKRON, Ohio, October 29, 2015 – The Goodyear Tire & Rubber Company today reported record results for the third quarter of 2015.
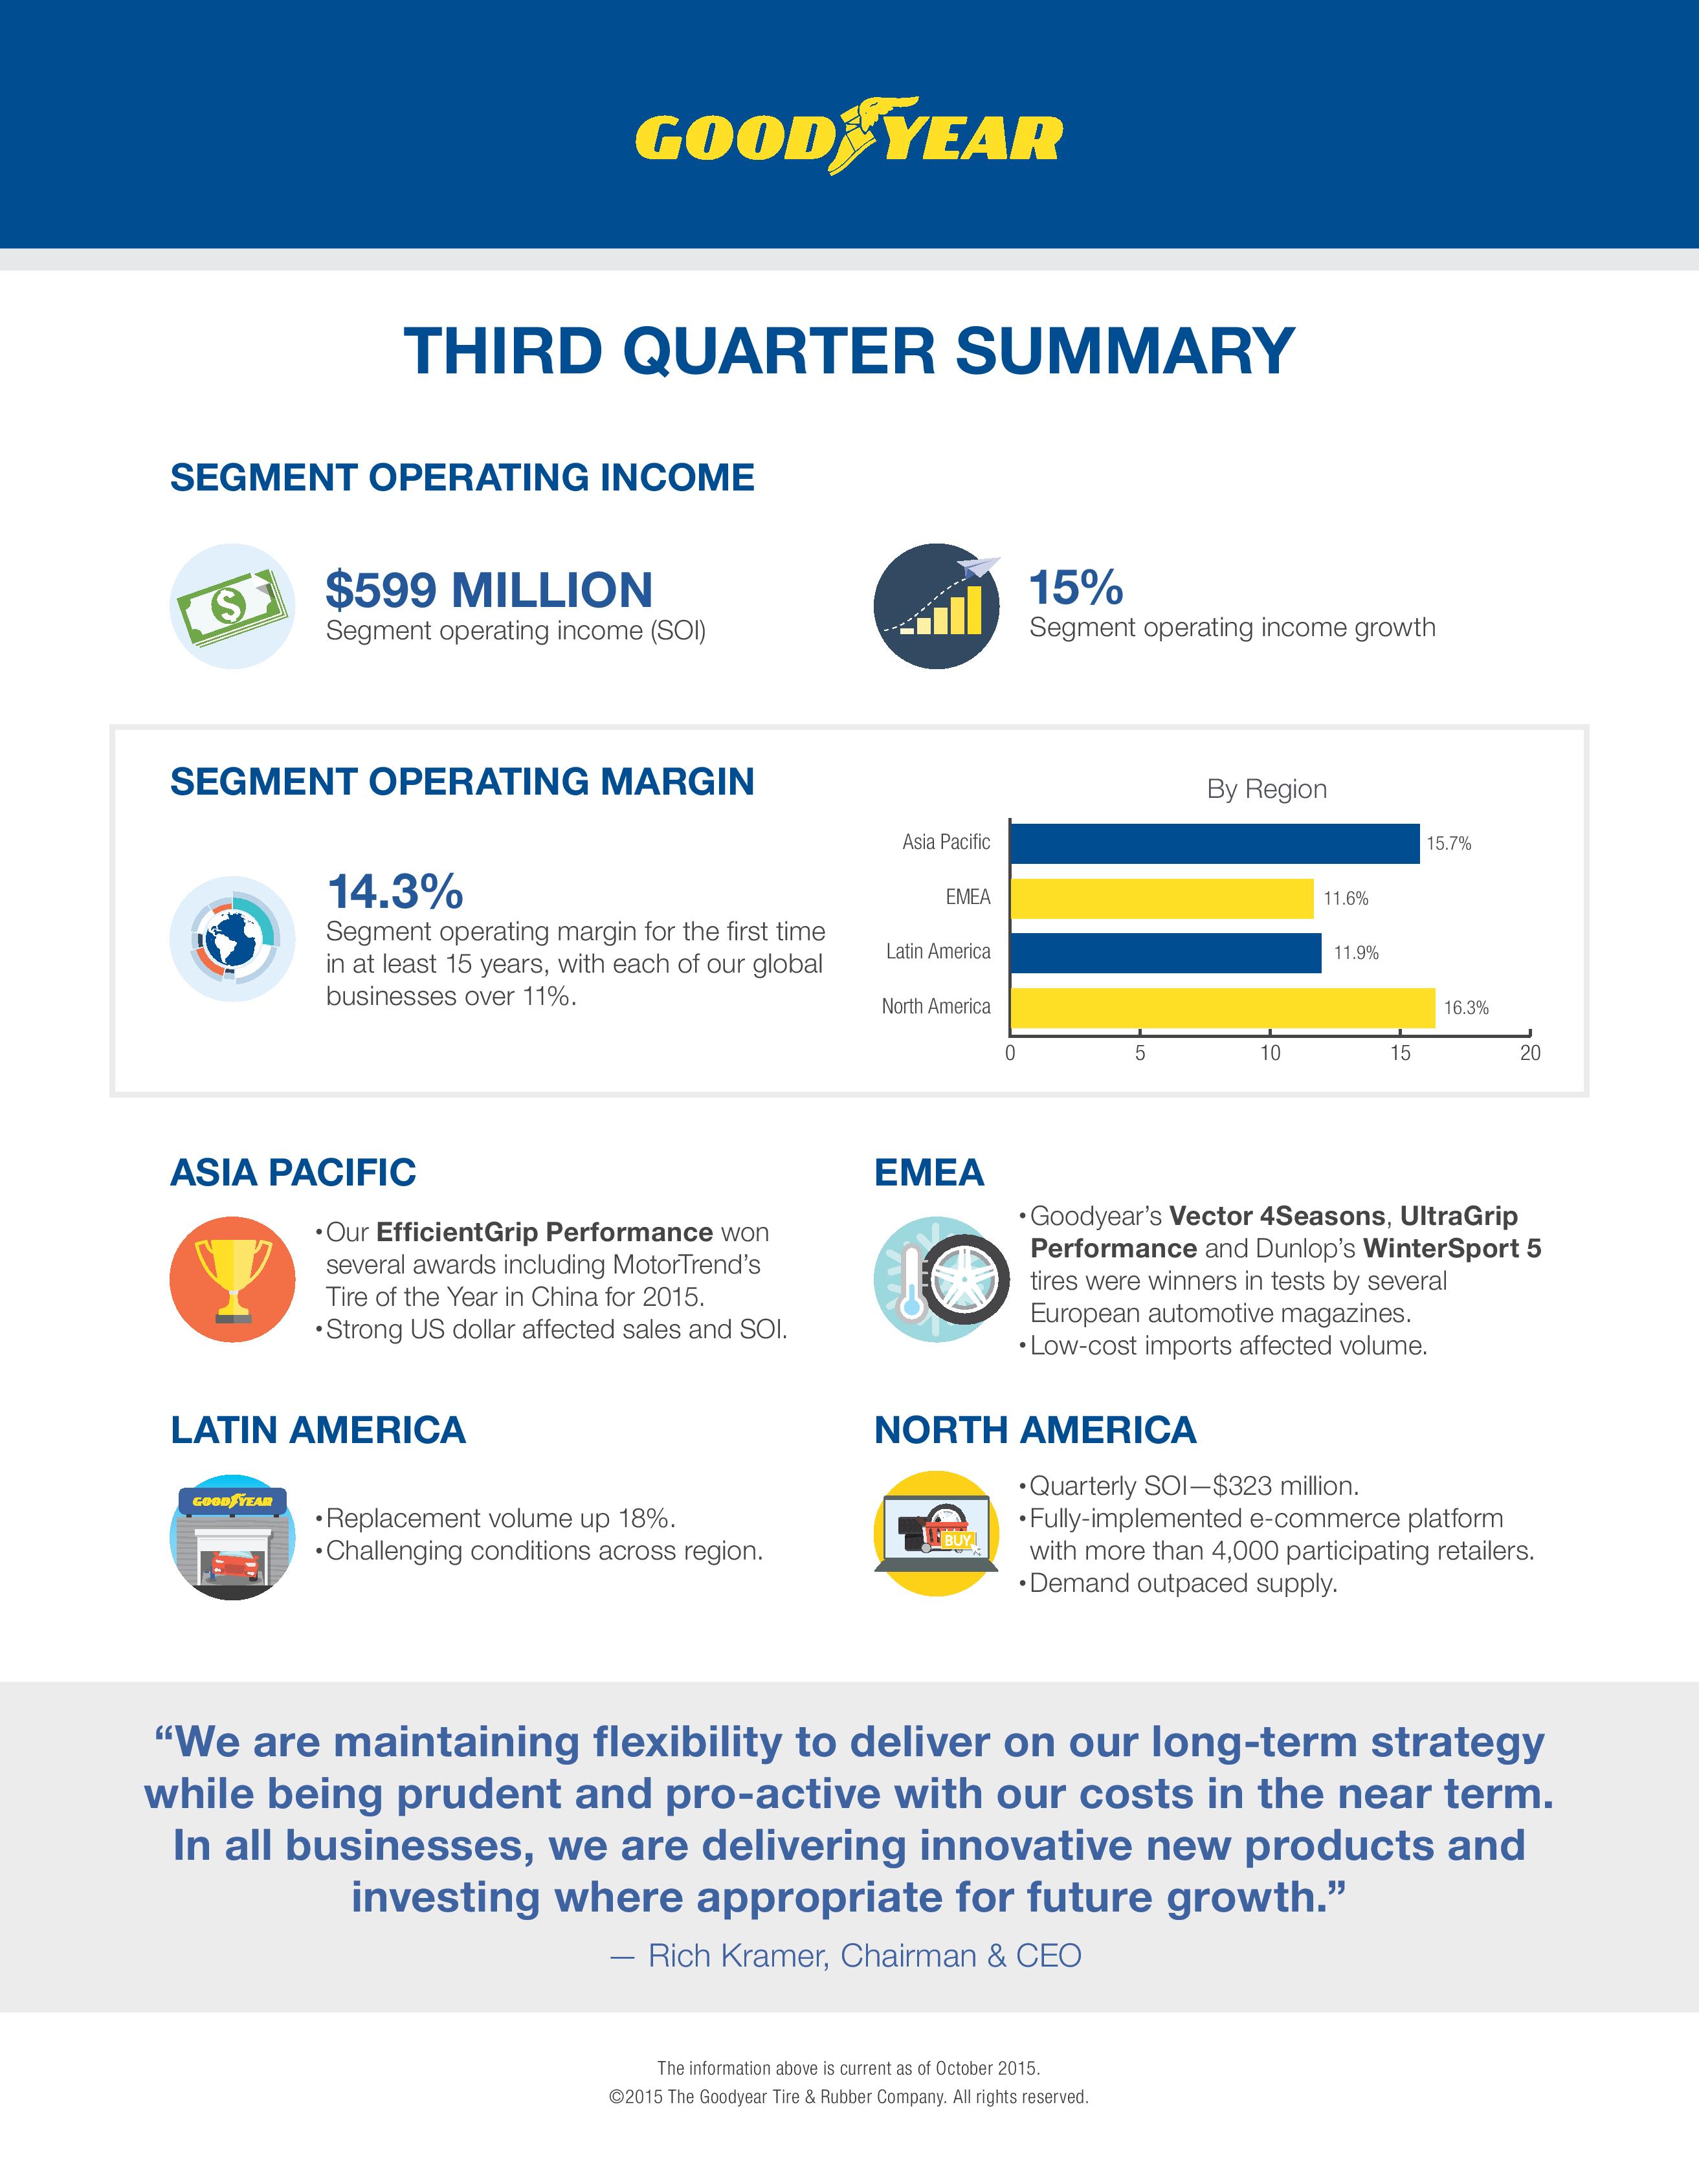
“We delivered outstanding earnings growth in the quarter and segment operating margin of more than 14 percent, overcoming macroeconomic challenges in some of our key international markets,” said Richard J. Kramer, chairman and chief executive officer.
“Our strong momentum in North America continues. The business grew its segment operating margin to more than 16 percent and achieved a 54 percent year-over-year increase in earnings driven by strong demand for our high-value-added products,” he said.
Kramer added, “Our third quarter results demonstrate continued sustainable earnings growth and our sharp focus on disciplined execution of our strategy in both strong and challenging markets. With our strong year-to-date performance, we now see full-year segment operating income tracking to $2 billion, which would be more than double what we achieved just five years ago.”
Goodyear’s third quarter 2015 sales were $4.2 billion, down from $4.7 billion a year ago, with the decrease largely attributable to unfavorable foreign currency translation of $430 million.
Tire unit volumes totaled 42.5 million for the third quarter of 2015, up 1 percent from last year. Original equipment unit volume was up 4 percent. Replacement tire shipments were flat.
The company reported third quarter segment operating income of $599 million in 2015,
up 15 percent from a year ago and a record for any quarter. The increase was driven by favorable price/mix net of raw materials, partially offset by unfavorable foreign currency translation.
Goodyear’s third quarter 2015 net income was $271 million (99 cents per share). Adjusted net income was also $271 million (99 cents per share). Per share amounts are diluted.
Third quarter 2015 adjusted net income was also impacted by $84 million (30 cents per share) of U.S. tax expense following the release of the company’s U.S. tax valuation allowance in the fourth quarter of 2014. Due to tax credits and prior tax-loss carryforwards, the company does not expect to pay significant cash income taxes in the United States for about five years.
Goodyear’s third quarter 2014 net income was $161 million (58 cents per share). Excluding certain significant items, adjusted net income was $242 million (87 cents per share). Per share amounts are diluted.
Year to Date
Goodyear’s sales for the first nine months of 2015 were $12.4 billion, down 10 percent from the 2014 period, reflecting unfavorable foreign currency translation of $1.2 billion. Tire unit volumes totaled 124.1 million for the first nine months of 2015, up 1 percent from 2014. Original equipment unit volume was up 4 percent. Replacement tire shipments were flat.
The company’s year-to-date segment operating income of $1.5 billion was up 14 percent from last year. Compared to 2014, year-to-date segment operating income reflects the benefits of favorable price/mix net of raw materials and cost reduction actions, which exceeded the impact of unfavorable foreign currency translation and inflation.
Goodyear’s year-to-date net income available to common shareholders of $687 million ($2.51 per share) is up from $316 million ($1.15 per share) in 2014’s first nine months. Excluding certain significant items, 2015 adjusted net income was $649 million ($2.39 per share). All per share amounts are diluted.
See the note at the end of this release for further explanation and reconciliation tables for Segment Operating Income and Margin; Free Cash Flow from Operations; Adjusted Net Income; and Adjusted Diluted Earnings per Share, reflecting the impact of certain significant items on the 2015 and 2014 periods.
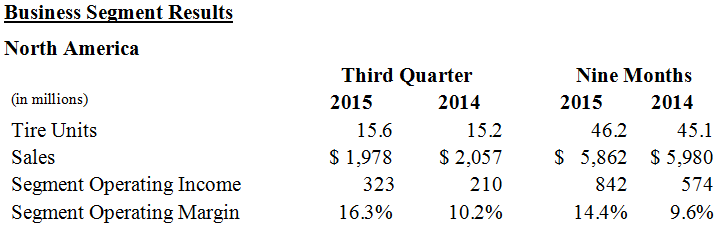
North America’s third quarter 2015 sales decreased 4 percent from last year. A 3 percent increase in tire unit volume was more than offset by a decrease in other tire-related sales, principally third-party chemical sales. Original equipment unit volume was up 8 percent. Replacement tire volume was up 1 percent.
Third quarter 2015 segment operating income of $323 million was a 54 percent improvement over the prior year and a record for any quarter. The improvement was primarily driven by favorable price/mix net of raw materials, as well as cost reduction actions.
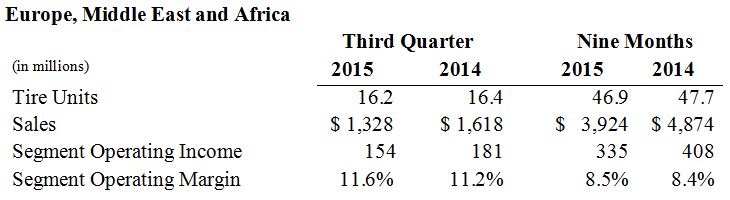
Europe, Middle East and Africa’s third quarter sales decreased 18 percent from last year to
$1.3 billion, primarily due to unfavorable foreign currency translation. Sales also reflect a 2 percent decrease in tire unit volume. Original equipment unit volume was up 6 percent. Replacement tire shipments were down 4 percent.
Third quarter 2015 segment operating income of $154 million was 15 percent below the prior year primarily due to unfavorable foreign currency translation.
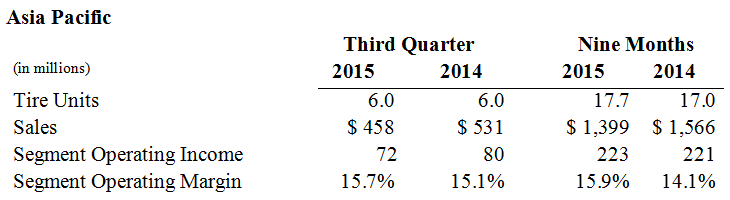
Asia Pacific’s third quarter sales decreased 14 percent from last year to $458 million, primarily due to unfavorable foreign currency translation. Tire unit volumes were flat. Original equipment unit volume was up 6 percent. Replacement tire shipments were down 5 percent.
Third quarter 2015 segment operating income of $72 million was down 10 percent from last year, primarily driven by higher SAG expenses and unfavorable foreign currency translation.
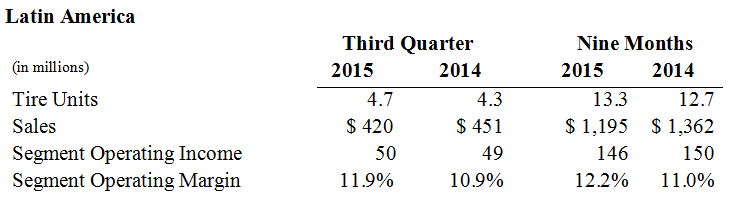
While Latin America’s third quarter tire unit volumes were up 8 percent, sales decreased
7 percent as volume growth and favorable price/mix were more than offset by unfavorable foreign currency translation. Replacement tire shipments were up 18 percent. Original equipment unit volume was down 21 percent.
Third quarter segment operating income of $50 million was up 2 percent from a year ago primarily due to favorable price/mix net of raw materials, which more than offset the impact of higher inflation.
Operating income in Venezuela was $39 million, up $12 million from 2014’s third quarter. Third quarter 2015 operating income excludes foreign currency exchange losses related to the Venezuelan bolivar fuerte of $8 million.
Click on the image below to view an infographic summary of Q3 2015 results.